Lab · agent observability
Watch the agents work.
What this shows
I ran 13 code checks over 77 real runs of the AI agents that built this site, then labelled every run Good or Bad myself. The checks barely agree with me: “all required checks pass” reaches a kappa of 0.16, close to chance. A plain size rule, under 40 tool calls, agrees far better at 0.50.
- All required checks pass0.16 [−0.04, 0.35]
- Recovered after error, long runs0.35 [0.14, 0.62]
- Run size: under 40 tool calls0.50 [0.30, 0.68]
Long runs: the 27 runs with 40 or more tool calls and an error. Intervals from 5,000 resamples of the runs, fixed seed (agent-traces-kappa.json).
Real traces from the AI agents that built this site: every model call, allowlisted tool call and handoff, with code evaluators on top.
The data comes from OpenCode’s local session store on my machine, November 7–12, 2026, exported by a script that keeps structure and numbers only. Prompts, responses, file contents and commands are never published, and calls to tools outside an allowlist are dropped (25 of them). Model latency is estimated from message timings. The evaluators are code checks; there is no LLM judge, and they measure how the work ran, not whether the result was good. To keep the file small, most spans are merged into summary spans; the totals, percentiles and evaluator results use every span.
Dashboard
All 77 traces · every span
- Traces
- 7776 requests, 1 compaction
- Spans
- 1,015published, 193 of them summaries · 17,412 recorded
- LLM steps
- 7,515model calls
- Tool calls
- 9,712bash, browser, edits, reads
- Subagent runs
- 108handoffs to specialists
- Tool error rate
- 1.7%162 failed calls
- LLM latency p50 / p90
- 5.4 / 21.5 sestimated, all steps
- Tokens
- 1.91 B1.82 B of them cache reads
Traces
One row per request I gave the agents, except #35, an automatic context compaction. Sort by any column; open a trace to see its spans.
No trace matches these filters.
Trace
Arrow keys move through the spans; Right and Left open and close a run. Merged steps open into their tool counts; their per-step timing is not published.
Release gate: would these runs ship?
Every recorded run is re-scored in your browser from its published score. Move a threshold or drop a check and see what a gate would block.
40 of 77 scored runs would be blocked. Review before commit blocks the most: 20 runs.
Review before commit blocks the most: 20 runs.
The published thresholds, with every check required, block 40: the same runs the “Failed a check” filter finds.
Blocked runs · open one
An offline re-scoring of recorded runs: the scores are fixed and only the thresholds move. Arize runs the live version on new traffic and calls it online evals. The checks are rule-based proxies for how the work ran (did tests run, did a review happen, did calls fail), not judgments of whether the result was good; the human review below tests them against a person.
Human review: do the checks agree with a person?
Label runs Good or Bad, then see how often each check says the same. Change the gate above and the agreement follows its thresholds.
Labels were made on an earlier export and were set aside.
Your labels stay in this browser (localStorage, one key) and are never sent anywhere: the page sends nothing to any server; it only loads its own files. Labels name the export they were made on, because trace numbers can change between exports; labels from an earlier export are set aside and can still be downloaded. The download has the same shape as the file that holds Cesar’s labels.
| Cesar’s labels · not labelled yet | Your labels | |||||
|---|---|---|---|---|---|---|
| Check | n | Agree | Kappa | n | Agree | Kappa |
Cesar’s labels: not labelled yet.
What my labels showed
I labelled all 77 runs myself: 56 good, 21 bad. At the published thresholds the checks barely agree with me. “All required checks pass” reaches a kappa of 0.16 (bootstrap interval −0.04 to 0.35), and five of the nine pass/fail checks fall below zero, most of all the two review checks.
Run size explains my labels better than any check. Calling every run under 40 tool calls Good agrees with me 77% of the time (kappa 0.50, interval 0.30 to 0.68). The 40-call line is the size rule the delegation check already used before I labelled anything, not one picked to fit the labels. Of the 33 runs with 40 calls or more I marked 18 bad; of the 44 smaller ones, 3. The bad long runs took a median of 77 minutes and 355 tool calls, the good ones 32 minutes and 150. One caveat: I labelled runs I had built the checks for, and the labelling view showed each run’s size, so part of this agreement may come from what I could see rather than from the runs alone.
On the long runs alone, only one check agrees with me in a meaningful way: all 8 runs that failed “Recovered after error” are runs I marked bad (kappa 0.35, interval 0.14 to 0.62, on 27 runs); every other check stays at 0.07 or below. Their error rates differ too, a median of 1.9% against 0.5%, but the 10% threshold never fires on a long run.
Next: a run-length budget and a lower error threshold, tested on runs I label after this export rather than on these 77, so the checks are not fitted to the labels they are scored against. A Good or Bad click also doesn’t record why, so new labels will carry a reason.
How agreement and kappa work
A human Good is compared with a check’s pass, Bad with fail, on the traces that are both labelled and scored by that check; “All required checks pass” compares Good with “no required check failed at the gate’s thresholds”.
Agreement is the share of those traces where the two say the same. Cohen’s kappa corrects it for the agreement two raters would reach by chance: κ = (po − pe) / (1 − pe), where po is the observed agreement and pe = (share Good × share pass) + (share Bad × share fail). 1 is perfect agreement, 0 is chance, below 0 is worse than chance. A dash means fewer than five traces, or that one side gave the same answer every time, so chance agreement is total and kappa is undefined.
Agent graph
Who started whom across all 77 traces: the orchestrators on the left, the specialists they handed work to on the right. Open a trace and its own path lights up.
- 0% failed
- under 2%
- 2–5%
- 5% or more
- no tool calls
Circle area: tool calls. Line width: subagent runs started.
Failure analysis
Every failed tool call, sorted into one class. Choose a class to filter the trace list; open a trace and the spans where it happened are marked.
The classes come from regular-expression rules the exporter applies to each error message on my machine, first match wins (timeout, permission, not found, bad arguments, test failure, network, other). A JavaScript error from a script the agent ran counts as other, and an HTTP status counts only when the message calls it a status or code. The message itself is private and never published; only its class is.
Pass rate by day
Each pass/fail check, one calendar day at a time, from 0% at the bottom to 100% at the top. Dot size and n show how many runs it scored; a day with none is a gap, not a zero. Days are November 7 to 12.
Sessions
The six OpenCode sessions the work ran in, S1 to S6 in the order they began. Choose one to filter the trace list.
| Session | Traces | Tool calls | Failed calls | Subagent runs | Recovered | Review | Tests | Checked | Latency |
|---|
Compare two groups
Pass rates per check for two groups of runs, side by side, with the difference.
- Group A
- Group B
| Check | A | B | B − A | Both on a 0 to 100% scale |
|---|
Descriptive, not an experiment: the groups did different tasks, on different days, at different points in the build, so a difference is not the effect of any one change. Arize’s experiments rerun the same dataset under two settings; this compares two slices of history.
Charts
For all 77 traces.
Latency by span kind
Show the numbers
| From | To | Spans |
|---|
Tokens by agent
- Input
- Output
- Reasoning
- Cache read + write
Cache reads are context the model read again from the provider’s cache; they dominate the total. Turn the cache off to compare what each agent read fresh and wrote.
Tools
Delegations by subagent
Traces per day
Outline: every trace that day. Fill: the traces that match the filters. Choose a day to filter by it.
Evaluator matrix
- Pass
- Fail
- Not scored
- Number (brighter = higher in its row)
- Error class
One column per trace, one row per evaluator. Choose a cell to open that trace; arrow keys move between cells.
Evaluators
Thirteen deterministic checks, scored per trace on every span; a check only runs where it applies. They are rule-based operational proxies: they say whether tests ran, a review happened or calls failed, not whether the result was good. Nine pass or fail against a published threshold, three are numbers and one names a category.
-
Tool error rate
Did the agents mostly call their tools correctly?
Rule. Passes when 10% or fewer of the trace’s tool calls returned an error.
65 pass · 3 fail · scored on 68 traces
Nine traces made no tool call and are not scored. An error is any call the tool reported as failed; the failure analysis on the dashboard says which kind.
-
Recovered after error
When a tool call failed, did the agent retry or fix it?
Rule. Passes when every failed call is followed, later in the same trace, by a successful call of the same tool.
24 pass · 9 fail · scored on 33 traces
Only traces with an error are scored. The match is by tool name, so any later successful call of that tool counts, even one that did something else: a pass is a weak signal, a fail is worth opening.
-
Delegation on large tasks
On big jobs, did specialists do most of the hands-on work?
Rule. On a large trace (40 or more tool calls, or 3 or more edits, subagents included), passes when subagents made at least half of the trace’s tool calls. The score is that share.
28 pass · 5 fail · scored on 33 traces
Small traces are not scored: a short question or a plan does not need a specialist. One token subagent run is not enough to pass, since the share counts calls, not runs. Size is a rough stand-in for “big enough to delegate”.
-
Review before commit
Was the change reviewed before it was saved?
Rule. Passes when a quality-reviewer run finished after the previous commit in the same session (or the start of the window) and before the trace’s last commit.
12 pass · 20 fail · scored on 32 traces
Needs context. The check looks back only to the previous commit in the same session, so when a reviewed commit is followed by a quick “go ahead” turn that commits small fixes, that later commit has no review of its own and fails, even though the work around it was reviewed. Read the fails trace by trace before calling them gaps.
-
Tests before commit
Were the tests run before the change was saved?
Rule. Passes when a test command finished in that same window.
31 pass · 1 fail · scored on 32 traces
It shows that tests ran, not that they passed: commands are reduced to a category inside the exporter, and their output is never read.
-
Checked after the last edit
Was the final state of the change tested or built?
Rule. Passes when, after the trace’s last successful edit (by any agent), a test, check or build command finished with exit code 0, or with no exit code recorded.
21 pass · 4 fail · scored on 25 traces
Only traces that edit are scored. The exit code is the only part of the result the exporter reads, so a run that printed failures but exited 0 still counts, and so does a completed call whose exit code the session store did not record.
-
No stuck loop
Did an agent keep repeating a failing call?
Rule. Passes unless one agent run called the same tool and failed 3 or more times in a row.
68 pass · 0 fail · scored on 68 traces
Any other call in between breaks the streak. Nothing failed here: the longest streak was 2.
-
Changes after review
Did the review lead to changes before the commit?
Rule. Where a review finished before a commit, passes when at least one edit followed a review and came before the next commit.
3 pass · 9 fail · scored on 12 traces
A clean review with nothing to fix also fails, so read a pass as “the review changed something”, not as better work.
-
Model latency budget
Did the model respond quickly enough to keep the loop moving?
Rule. Passes when the trace’s p90 model-step latency is under 30 s.
68 pass · 9 fail · scored on 77 traces
Latency is estimated from message timings, from a step’s start to the start of its last tool call; the store has no time to first token. A step that ends without a tool call runs to the end of its message, which pushes p90 up.
-
Generated tokens per tool call
How much did the model write for each action it took?
Rule. Output plus reasoning tokens, divided by tool calls. A number, not pass or fail.
Median 747 · range 165–2,951 · 68 traces
Lower means terser actions. Cache reads are left out: they are context the model read again, not text it wrote.
-
Parallel subagents
How much work ran in parallel?
Rule. The most subagent runs open at the same moment in the trace. A number.
Median 2 · range 1–4 · 32 traces
Only traces with a subagent run are scored. More is not better by itself: parallel runs only help when their work is independent.
-
Prompt cache reuse
How much of each prompt came from the cache?
Rule. Cache-read tokens divided by all prompt tokens over the trace’s model steps. A number from 0 to 100%.
Median 93.4% · range 0%–99.9% · 77 traces
High reuse keeps long agent loops affordable and fast. 7 traces read nothing from the cache, among them the context compaction, which writes a fresh summary instead of reading one.
-
Most common error
What kind of failure was most common?
Rule. Each failed call gets one class from its error text inside the exporter; the label is the trace’s most common class. A category, not pass or fail.
Most often not found (11 traces) · scored on 33 traces
The error text is never published, only the class. The failure analysis on the dashboard counts every failed call by class.
Take the data with you
Both files are public: structure and numbers only, the same privacy rules as this page.
- agent-traces.json 341 KBThe file this page reads: traces, spans, evaluations, thresholds and rollups.
- agent-traces.openinference.jsonl 438 KBOne published span per line, OpenTelemetry-style, with OpenInference attribute names.
OpenInference attributes used
openinference.span.kindsession.idagent.nametool.namellm.model_namellm.token_count.promptllm.token_count.completionllm.token_count.totalllm.token_count.prompt_details.cache_read llm.token_count.prompt_details.cache_write llm.token_count.completion_details.reasoning error.class(custom)error.count(custom)error.class.<class>(custom)
A failed tool call carries error.class. A merged-steps row whose calls include failures carries error.count and one error.class.<class> count per class, and its status is ERROR, so the file counts every failed call the dashboard counts. There is no input.value or output.value. Times use a synthetic clock: each trace starts at midnight UTC on its real calendar day and its spans keep their real offsets.
Load it into Arize Phoenix
Tested November 13, 2026. This snippet ran unchanged against a local Arize Phoenix 20.16.0, and Phoenix showed 77 traces and 1,015 spans in the project agent-traces. It replays each span to Phoenix over OTLP (http://localhost:6006/v1/traces); the spans get new trace and span ids.
# pip install opentelemetry-sdk opentelemetry-exporter-otlp-proto-http pandas
import json
from datetime import datetime
from opentelemetry import trace
from opentelemetry.sdk.resources import Resource
from opentelemetry.sdk.trace import TracerProvider
from opentelemetry.sdk.trace.export import BatchSpanProcessor
from opentelemetry.exporter.otlp.proto.http.trace_exporter import OTLPSpanExporter
from opentelemetry.trace import Status, StatusCode

provider = TracerProvider(resource=Resource.create({"openinference.project.name": "agent-traces"}))
provider.add_span_processor(BatchSpanProcessor(OTLPSpanExporter(endpoint="http://localhost:6006/v1/traces")))
tracer = provider.get_tracer("agent-traces-replay")
ns = lambda iso: round(datetime.fromisoformat(iso.replace("Z", "+00:00")).timestamp() * 1000) * 1_000_000

spans = {}
with open("agent-traces.openinference.jsonl") as lines:  # a parent always comes before its children
    for line in lines:
        row = json.loads(line)
        parent = spans.get(row["parent_id"])
        context = trace.set_span_in_context(parent) if parent else None
        span = tracer.start_span(row["name"], context=context, attributes=row["attributes"], start_time=ns(row["start_time"]))
        if row["status_code"] == "ERROR":
            span.set_status(Status(StatusCode.ERROR))
        span.end(end_time=ns(row["end_time"]))
        spans[row["span_id"]] = span
provider.shutdown()  # flushes the batch

# Or explore it as a dataframe:
import pandas as pd
df = pd.read_json("agent-traces.openinference.jsonl", lines=True)
df = df.join(pd.json_normalize(df.pop("attributes").tolist()))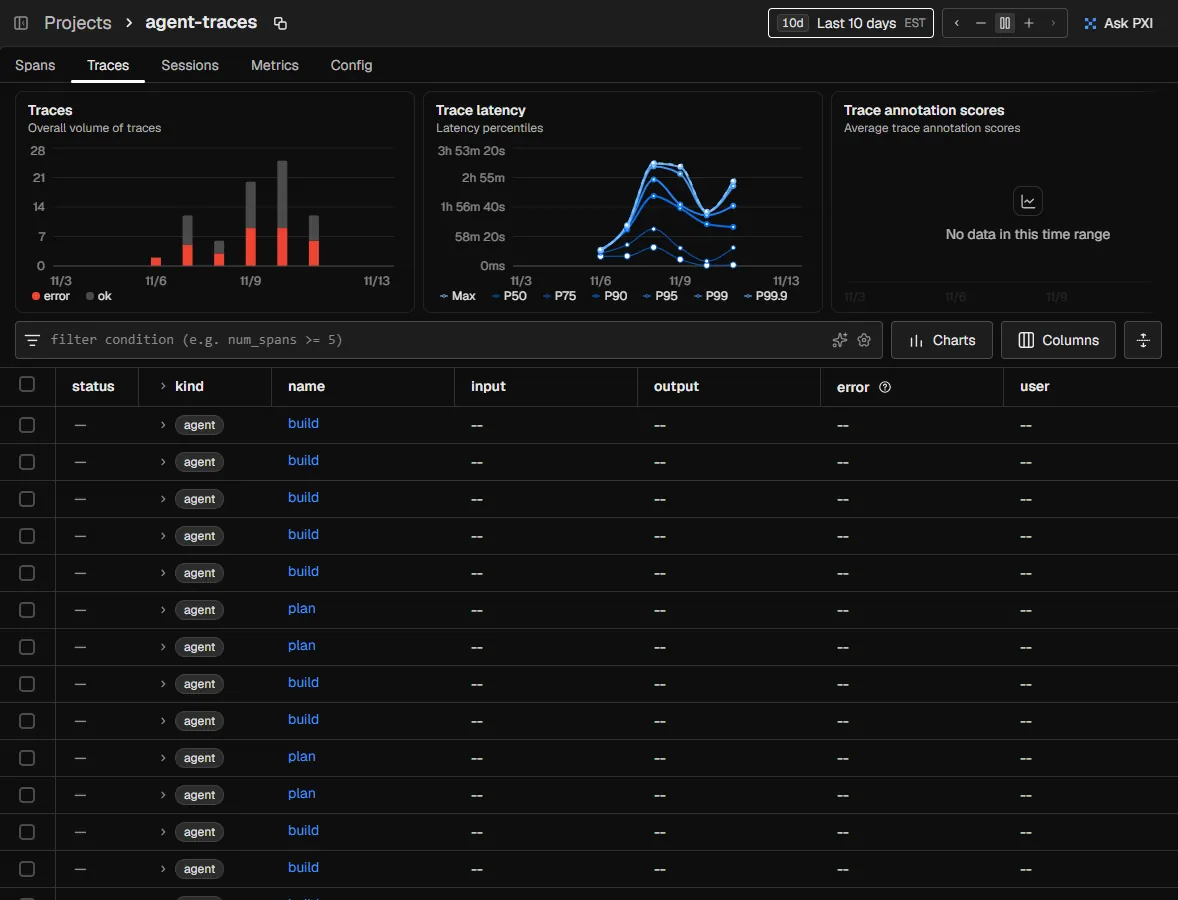
Phoenix docs: Exporter and OTLP (Phoenix takes OTLP/HTTP on port 6006, at /v1/traces).
What this data is, and isn’t
- Where it comes from. OpenCode, the coding agent I work in, keeps every session in a local database. A script reads it read-only and writes agent-traces.json in an OpenInference-style shape: agent, LLM, tool and merged-step spans with times, status and token counts.
- What it covers. The website work from November 7 to 12, 2026: 76 requests and one automatic context compaction in six sessions, with 81 subagent sessions nested under the calls that started them. Some sessions ran more than once, so the dashboard counts 108 subagent runs. Unrelated work in the same sessions is left out.
- What is never published. Prompts, responses, reasoning, tool inputs and outputs, error messages, file names and contents, and commands. A shell call carries only a category (test, build, commit and so on) and a failed call only an error class. Calls to tools outside an allowlist are dropped: 25 of them.
- What is estimated. Model latency, from message timings. Tool and agent times come straight from recorded timestamps.
- Merged spans. Of the 17,412 recorded spans, 822 are published one by one. The other 16,590, runs of ordinary steps, are merged into 193 summary spans that keep their step, tool-call, error and token counts, so the file has 1,015 spans. Every total, percentile and evaluator result is computed from all spans before merging.
- No judge model. The thirteen evaluators are code. Nothing here is graded by an LLM, and the checks describe the process, not the quality of the result; human labels are the way to test them. There is no cost figure: the runs used a flat-rate subscription.